3D Knowledge Explorer
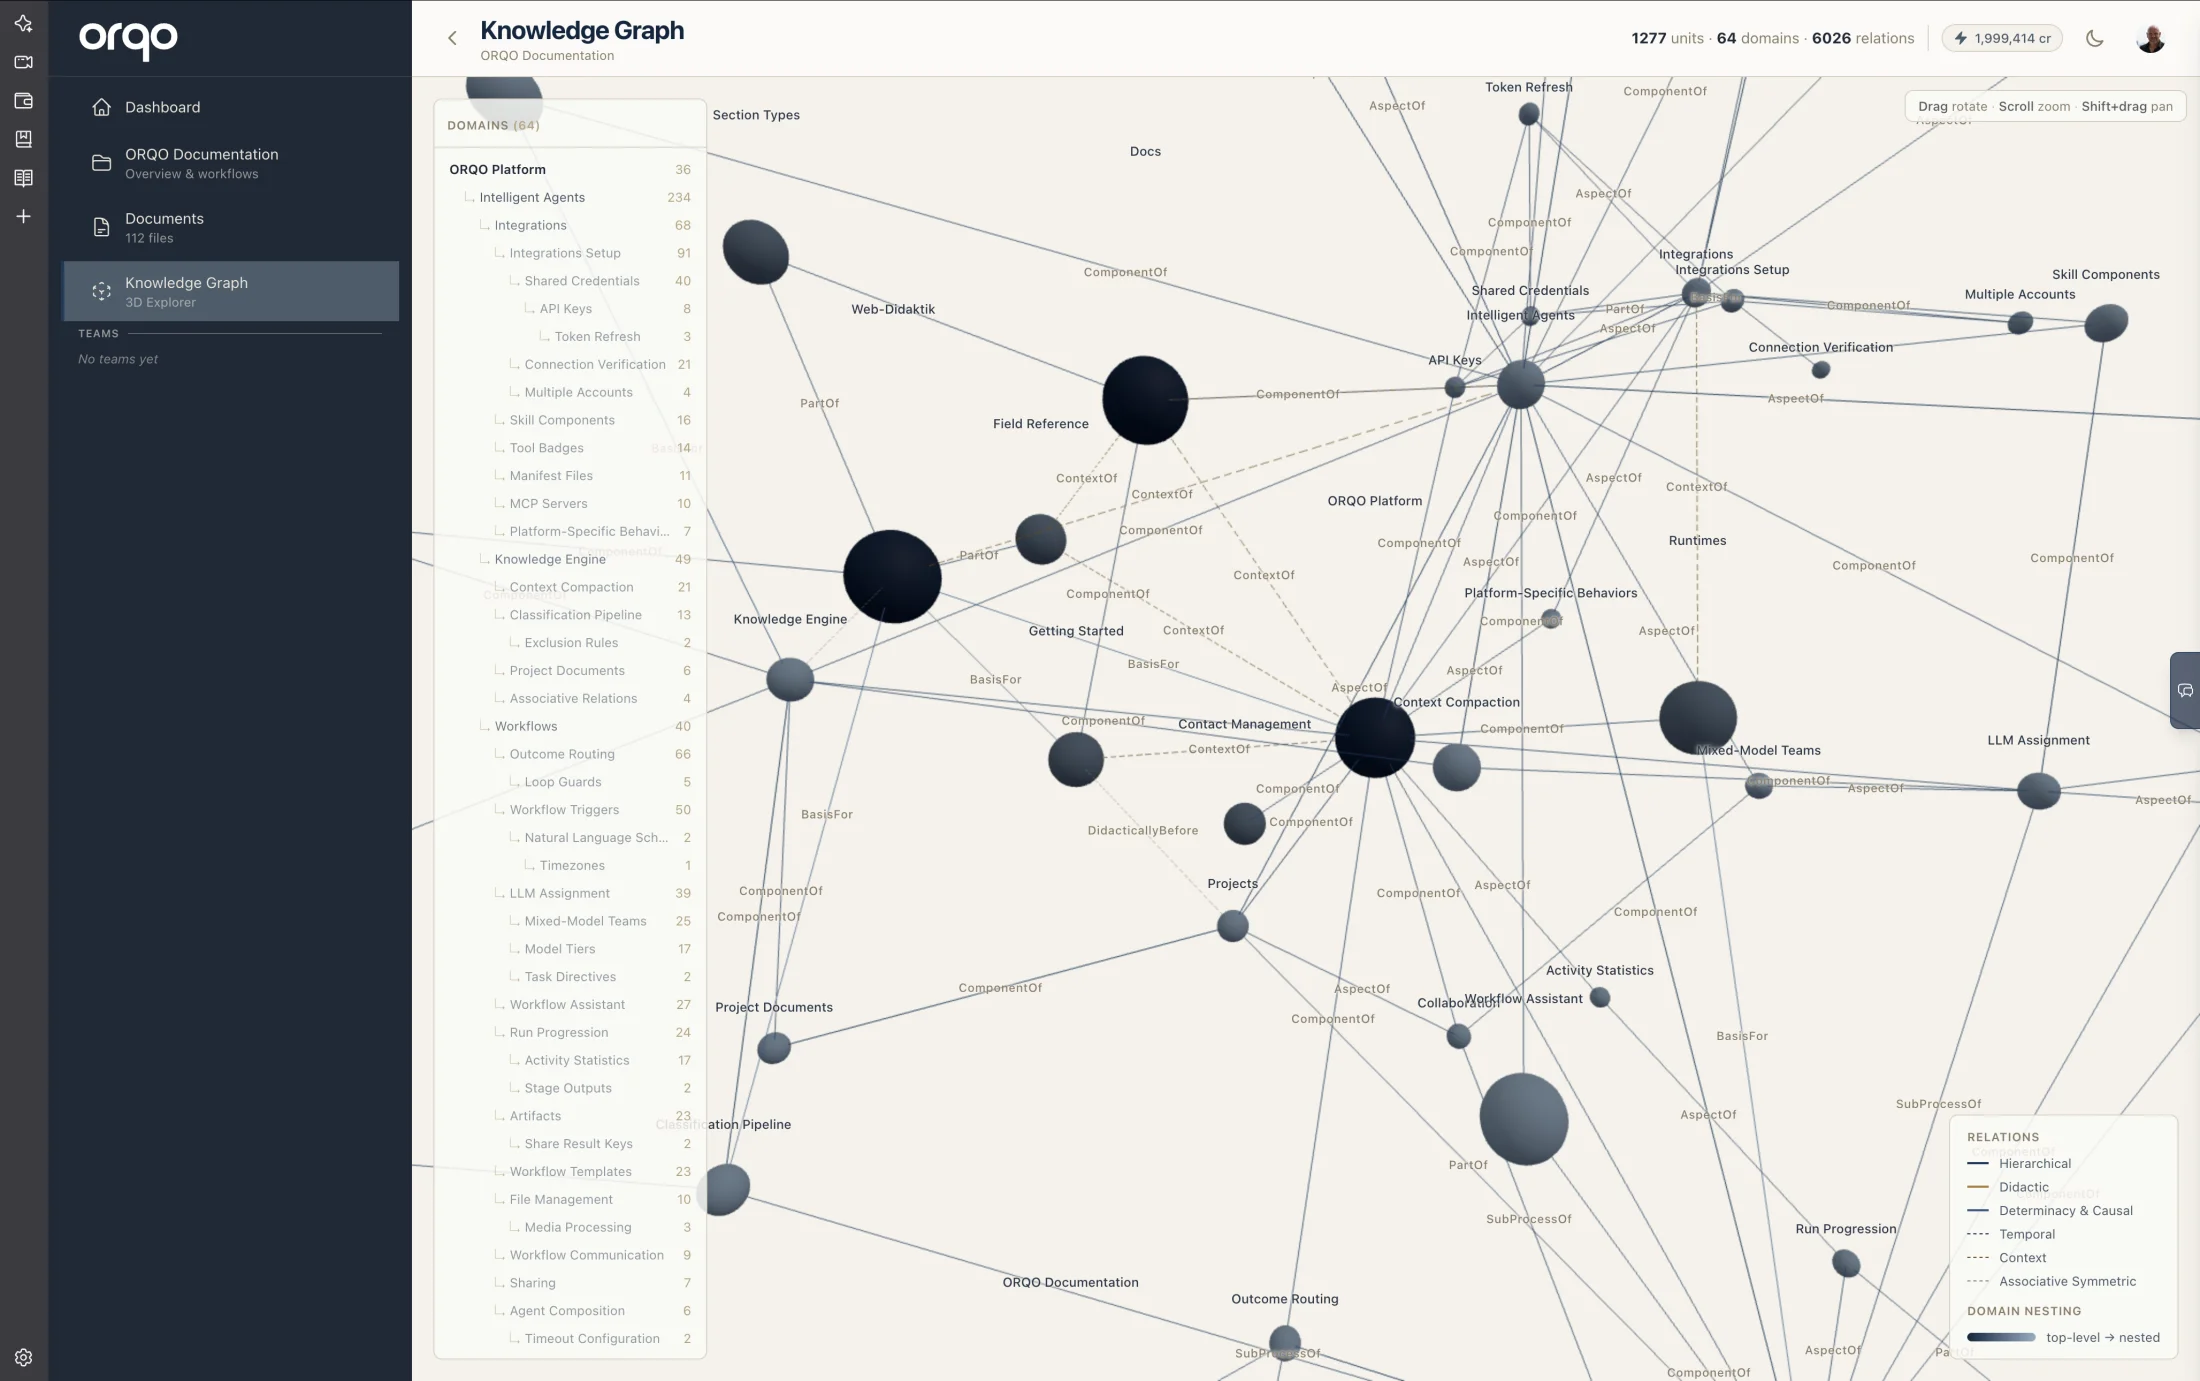
The 3D Knowledge Explorer gives you a visual, interactive map of your project's knowledge graph. Domain containers appear as spheres in 3D space, connected by typed ontology relations that you can see, read, and explore.
It's a way to understand — at a glance — what your knowledge graph contains, how domains relate to each other, and what's inside each domain. A docked domain navigator on the left lists the whole hierarchy as a tree, and the view follows both light and dark themes.
Opening the Explorer
Navigate to your project and click Knowledge Graph in the sidebar under Resources. The explorer is available on any project that has Long-Term Memory enabled.
The page header shows your graph's stats: total knowledge units, domain count, and relation count.
The Domain Graph
When the explorer loads, you see the domain-level view: every concept container in your knowledge graph rendered as a sphere.
Spheres are sized and shaded by their place in the hierarchy, so the structure reads at a glance without rotating the view:
- Top-level domains are the largest and the most prominent in color (darkest on a light background, lightest on a dark one).
- Nested sub-topics step down in size and fade with each level deeper.
(Unit count nudges the size slightly within a level, so two domains at the same depth aren't identical — but depth is the dominant cue.)
Spheres are connected by lines representing the typed relations between domains. Each line is labeled with the specific relation type — ComponentOf, Alternative, Specializes, and so on.
The Domain Navigator
A panel docked on the left lists every domain as an indented hierarchy tree — top-level domains in bold, sub-topics nested beneath their parent with a ↳ marker, each showing its unit count. It's the same hierarchy you see in the graph, in a scannable outline.
Click any domain in the tree and the camera smoothly glides over to that domain's sphere, centering it along with its immediate neighbors and the relation lines between them. The clicked row stays highlighted. It's the fastest way to jump to a specific topic in a large graph instead of hunting for its sphere by hand.
Relation Types
The edges follow the six categories from the classification ontology:
| Category | Examples | Line Style |
|---|---|---|
| Hierarchical | Generalizes, Specializes, PartOf, ComponentOf, AspectOf | Solid |
| Didactic | IsFormOf, IsMatterOf | Solid |
| Determinacy & Causal | CauseOf, Determines, BasisFor, PurposeOf | Solid |
| Temporal | TemporallyBefore, TemporallyAfter | Dashed |
| Context | ContextOf, InBackgroundOf, InForegroundOf | Dashed |
| Associative Symmetric | Similar, Alternative, Analogous, Complementary | Dashed |
A legend in the bottom-right corner shows these categories with their colors, plus the domain-nesting gradient (top-level → nested).
Expanding a Domain
Click any domain sphere to expand it. The domain's knowledge units appear as smaller spheres around the parent, connected by their inter-unit relations — the same typed edges from the ontology. Each unit is colored by its knowledge class:
| Color | Knowledge Class | What it represents |
|---|---|---|
| Light indigo | Orientation | Context-setting, overviews, problem statements |
| Light violet | Explanation | Definitions, theories, causal reasoning |
| Indigo | Action | Procedures, rules, checklists, strategies |
| Violet | Reference | Sources, archives, cross-references |
Units participate in the same 3D force simulation as domain nodes — they spread out naturally based on their connections, just like the domains themselves.
Domains with more than 100 knowledge units show the first 100. This keeps the visualization responsive. To explore the full contents of a large domain, use the AI Assistant's QueryKnowledgeGraph tool which can navigate the complete graph.
Expand Limit
Up to two domains can be expanded at the same time. Opening a third automatically collapses the oldest expanded domain. This keeps the scene readable.
Click an already-expanded domain to collapse it manually.
Interacting with the Graph
Hover
Hover over any node to see details:
- Domain nodes show the domain name and how many knowledge units it contains.
- Unit nodes show the title, knowledge class, knowledge type, and a content preview.
Hovering also highlights the node's direct connections — connected nodes and edges stay bright while everything else dims, making it easy to trace relationships.
Camera Controls
- Drag to orbit around the graph
- Scroll to zoom in and out
- Shift + drag to pan the view
- Click a domain in the navigator to glide the camera onto its sphere
Auto-rotate is on by default — the graph slowly rotates to give you a sense of the 3D structure — and stops the moment you interact (drag, zoom, or pick a domain). A small hint in the top-right corner reminds you of these controls.
What You're Looking At
The 3D explorer is a direct visualization of the same knowledge graph your agents navigate with the QueryKnowledgeGraph tool. The domains you see are the concept containers the classification pipeline creates. The edges are the typed relations the pipeline extracts. The knowledge classes coloring the unit nodes are the same four classes the classification ontology defines.
This means what you see in the explorer is exactly what your agents work with — the same structure, the same relations, the same navigation paths. It's a window into your agents' long-term memory.